This episode talks about the tools available to effectively report on the data within Salesforce to measure performance in Key Business Areas. Let join us to learn about Reports & Dashboards in Salesforce.
What is a Salesforce Report?
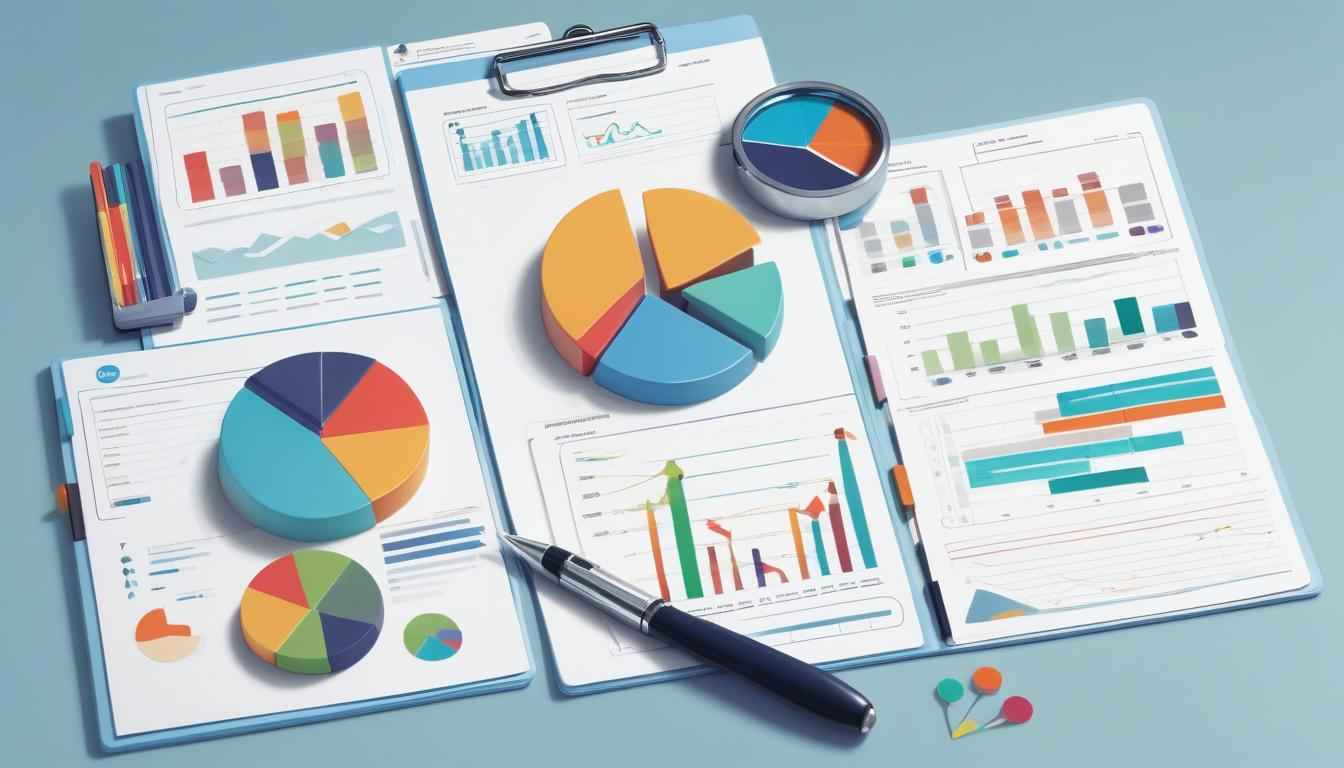
A report is a list of data generated based on filter criteria. Salesforce Reports helped us predict trends and gives us the advantage to increase profits. Admin can create reports quickly and can schedule the reports. Salesforce Dashboard or chart can be used to visualize and analyze your report data.
Report Types
- Report Types are the templates which gives you the ability to create the Reports in a different format.
- Out of the box, Salesforce provides a set of predefined standard report types.
- Don’t see all the fields you want? You might need to create a custom report type
- A report is a list of records that meet the criteria define by you.
- It’s displayed in Salesforce in rows and columns, and can be filtered, grouped, or displayed in a graphical chart.
- With the help of report you can show the key information about the objects. For Example, Top Accounts, Top Products, Successful Marketing campaign
What is Dashboards?
A dashboard is a visual display of key metrics and trends for records in your org. The Dashboards is collection of Reports, VF pages and other components.
URL Based Filter in Reports
URL based filters are used to filter based on some dynamic values. For Example, displaying the list of all the contacts records related to a single Account.


